Trend trading is a strategy that involves identifying and following a market trend to capitalize on its direction. It’s based on the principle that securities tend to move in a particular direction over time. The strategy requires patience and discipline, as the key is to ride the trend for as long as it lasts. It’s not about predicting the market’s top or bottom but about being right in the middle where the majority of the movement happens. This approach suits various timeframes and can be applied in different market conditions.
As a seasoned trader, I’ve seen firsthand how effective trend trading can be when executed with a clear understanding and respect for the market’s natural flow. Readers should delve into this article because it offers a comprehensive guide on trend trading, a strategy that capitalizes on market direction, providing valuable insights for both novice and seasoned traders.
I’ll answer the following questions:
- What is trend trading?
- How does the trend following algorithm work?
- Is trend following effective in stocks?
- What are the different types of trends in trading?
- What are the benefits of trading trends?
- How can traders analyze trends in trading?
- What are some effective trend trading strategies?
- What are the best indicators for trend trading?
Let’s get to the content!
Table of Contents
- 1 What Is Trend Trading?
- 2 Different Types of Trends in Trading
- 3 Benefits of Trading Trends
- 4 Analysis of Trends in Trading
- 5 Trend Trading Strategies
- 6 Best Indicators for Trend Trading
- 6.1 Moving Averages
- 6.2 Relative Strength Index (RSI)
- 6.3 Bollinger Bands
- 6.4 Trend Trading Chart Examples
- 6.4.1 Super League Gaming Inc. (NASDAQ: SLGG) — Strong Uptrend
- 6.4.2 Bayport International Holdings Inc. (OTCPK: BAYP) — Clean Uptrend and Downtrend
- 6.4.3 Ault Global Holdings Inc. (AMEX: DPW) — One and Done
- 6.4.4 Tesla Inc. (NASDAQ: TSLA) — Broken Trendlines
- 6.4.5 Thai Airways International Public Co. Ltd. (OTCPK: TAWNF) — Strong Intraday Uptrend
- 7 When Is the Best Time to Enter a Trend?
- 8 How To Trade With the Trend
- 9 Trend Trading With Price Action
- 10 What Are the Risks of Trend Trading?
- 11 Risk Management in Trend Trading
- 12 Key Takeaways
- 13 Frequently Asked Questions
What Is Trend Trading?
Trend trading is a strategy that focuses on identifying and following a market’s direction or trend. It’s based on the principle that markets tend to move in trends over time, whether in stocks, forex, or commodities. As a trend trader, you aim to capitalize on these movements by entering trades in the direction of the trend. This approach requires careful analysis of market indicators, charts, and patterns to predict future price movements. The key lies in recognizing the trend’s direction, whether it’s an uptrend, downtrend, or sideways trend, and making strategic trading decisions accordingly.
What Is the Trend Following Algorithm?
The trend following algorithm is a systematic approach used in trend trading to identify market trends based on historical data. This algorithm often utilizes technical indicators like moving averages or momentum indicators to signal when a trend is starting or ending. It’s designed to capture long-term movements rather than short-term fluctuations. While this method can be highly effective, especially in markets with strong trends, it requires discipline and patience. A key aspect of this strategy is to remain committed to the algorithm’s signals, even during periods of market volatility or when the trend appears to be changing.
Does Trend Following Work in Stocks?
Trend following can be particularly effective in the stock market due to its propensity for prolonged trends. Stocks often trend based on company performance, industry developments, and overall market conditions. By using trend following strategies, traders can potentially profit from both rising and falling markets. However, it’s important to recognize that no strategy guarantees success, and trend following in stocks requires a solid understanding of market analysis, risk management, and the discipline to stick to your strategy even when emotions suggest otherwise.
Different Types of Trends in Trading
In trading, trends are typically categorized into three main types: uptrends, downtrends, and sideways or horizontal trends. An uptrend is characterized by higher highs and higher lows, signaling increasing buyer interest. In contrast, a downtrend is marked by lower highs and lower lows, indicating growing seller pressure. Sideways trends occur when there’s a balance between buyers and sellers, leading to a relatively stable price range.
From my experience, recognizing these trends early is crucial for successful trading, as each type requires a different approach and set of strategies. For instance, candles forming a series of ascending peaks and troughs often signal an uptrend, offering clear examples for entry points.
Uptrend
An uptrend is characterized by a series of higher highs and higher lows, indicating a general upward trajectory in the market. This is often a sign of a strong, bullish market where buyers are in control. Trading in an uptrend typically involves buying stocks or assets that are rising in value, with the expectation that the upward trend will continue. It’s crucial to monitor for signs of a trend reversal or weakening momentum to adjust your strategy accordingly.
Downtrend
A downtrend is marked by lower highs and lower lows, suggesting a bearish market sentiment. In a downtrend, sellers dominate, and prices generally move downward. Traders might consider short-selling in a downtrend, betting on the continuation of the falling prices. As with uptrends, vigilance is key to spot potential reversals or slowdowns in the trend.
Sideways Trend
A sideways or horizontal trend occurs when the market is neither moving up nor down significantly. In this scenario, prices fluctuate within a relatively stable range. Sideways trends can present opportunities for range trading, where traders buy at the lower range and sell at the higher range. However, these trends can be challenging to navigate as they may lack clear directional signals.
Benefits of Trading Trends
Trading trends offer several benefits, including the potential for significant returns and the simplicity of the strategy. Trend trading aligns with the fundamental market principle that prices tend to move in a specific direction over time. By identifying and following these trends, traders can capitalize on market momentum.
My years of trading and teaching have shown that trend trading can be less stressful and more predictable compared to other strategies, especially for beginners. It allows traders to focus on clear market signals and trends, reducing the need for complex analysis.
Capitalizing on Market Momentum
Trend trading allows traders to capitalize on market momentum. By identifying and following the direction of the market trend, traders can align their positions with the prevailing market forces. This approach can lead to substantial profits, especially in strong and sustained trends.
Simplified Decision Making
One of the primary benefits of trend trading is the simplification of decision-making. By focusing on the direction of the trend, traders can filter out much of the market ‘noise’ and concentrate on signals that align with the prevailing trend. This clarity can be particularly advantageous for beginners, who might find the abundance of market data overwhelming.
Risk Management
Effective trend trading inherently incorporates risk management. By following trends and setting appropriate stop-loss orders, traders can minimize potential losses. Trend trading strategies often include predefined exit points, reducing the emotional impact of decision-making and helping to manage risk more effectively.
Profit Potential in Various Market Conditions
Trend trading offers the potential for profit in various market conditions. Whether the market is experiencing an uptrend, downtrend, or even a sideways trend, there are strategies within trend trading that can be employed to seek profit. This versatility is a significant advantage, allowing traders to adapt to changing market conditions.
Analysis of Trends in Trading
Analyzing trends in trading involves evaluating market movements to identify potential trend directions. This analysis is crucial for making informed decisions on entries and exits. Traders typically use a combination of technical indicators and price action to assess trends.
In my teaching experience, I emphasize the importance of understanding candle patterns and their implications for trend direction. For example, a series of bullish candles might indicate a strong upward trend, providing a basis for further analysis and decision-making. Effective trend analysis can lead to better trading results and a deeper understanding of market dynamics.
Identifying a Trend
Identifying a trend involves analyzing price charts and observing certain patterns or signals. Look for consistent movements in one direction, indicated by a series of higher highs and higher lows in an uptrend or lower highs and lower lows in a downtrend. Identifying a trend early is crucial for maximizing the potential of a trade.
Analyzing Price Charts and Patterns
Analyzing price charts and patterns is fundamental in trend trading. Charts provide a visual representation of market movements, helping traders to spot trends, reversals, and key levels of support and resistance. Patterns like triangles, head and shoulders, and flags can offer insights into market sentiment and potential future movements.
Utilizing Technical Indicators to Predict Market Direction
Technical indicators are essential tools in predicting market direction. Moving averages, Relative Strength Index (RSI), and Bollinger Bands are popular indicators that can help identify trends and potential entry and exit points. These indicators provide additional context to price movements, aiding in making more informed trading decisions.
Leveraging Financial Data and News to Generate Trade Ideas
In addition to technical analysis, staying informed with financial data and news is crucial for trend trading. Market trends can be influenced by economic reports, company earnings, and global events. Keeping abreast of this information can provide valuable insights and generate trade ideas that align with current market trends.
Trend Trading Strategies
Trend trading strategies involve identifying and following market trends to make profitable trades. Key strategies include riding long positions in an uptrend or short positions in a downtrend. Another effective strategy is to wait for retracements within a trend before entering a trade, which can offer a more favorable risk-reward ratio.
In my trading career, I’ve utilized these strategies to capitalize on market movements effectively. I often remind traders that the best strategy involves not only recognizing the trend but also understanding when to enter and exit trades for optimal results.
Trend-Following Strategy
The trend-following strategy involves entering trades in the direction of the established trend. This strategy assumes that the current trend will continue and aims to capitalize on this movement. Patience and discipline are key, as it’s crucial to stay with the trend until there are clear signs of a reversal.
Moving Averages
Moving averages smooth out price data to identify trends more clearly. Simple moving averages (SMA) and exponential moving averages (EMA) are widely used to determine trend direction and potential reversal points. A common strategy is to look for crossovers between different moving averages as a signal for entering or exiting trades.
Momentum Indicators
Momentum indicators, like the RSI or the Moving Average Convergence Divergence (MACD), help gauge the strength of a trend and potential turning points. They can signal whether a trend is likely to continue or if it’s losing momentum, which can be a precursor to a trend reversal.
Trendlines & Chart Patterns
Trendlines and chart patterns are tools to visually identify and confirm trends. Drawing trendlines along the highs and lows of price charts helps determine the direction and strength of a trend. Chart patterns such as ascending triangles in uptrends or descending triangles in downtrends can indicate potential continuation or reversal of trends.
Bollinger Band Strategy
Bollinger Bands are used to measure market volatility and identify overbought or oversold conditions. A common trend trading strategy is to buy when the price touches the lower Bollinger Band in an uptrend and sell when it touches the upper band in a downtrend.
MACD Crossover
The MACD crossover strategy involves using the MACD indicator to identify potential trend reversals. A bullish signal is generated when the MACD line crosses above the signal line, and a bearish signal when it crosses below. This strategy can help pinpoint entry and exit points in trend trading.
Ascending and Descending Triangles
Ascending triangles (characterized by a flat top and rising bottom) and descending triangles (with a flat bottom and descending top) are continuation patterns. In trend trading, these patterns can signal the likely continuation of the current trend, providing opportunities for entry.
Breakout Trading
Breakout trading is a strategy used to enter a trade when the price moves outside a defined support or resistance level with increased volume. This can indicate the start of a new trend or the continuation of an existing one, offering a strategic entry point for trend traders.
Retracement Trading
Retracement trading involves entering a trend when the price temporarily reverses direction but the overall trend remains intact. This strategy aims to capitalize on the ‘pullback’ in price, offering a potentially advantageous entry point within a prevailing trend.
Range Trading
Range trading is effective in sideways trends, where the price fluctuates within a consistent range. Traders buy at the lower end of the range and sell at the higher end, capitalizing on the predictable oscillation of prices within the defined range.
News Trading
News trading involves making trading decisions based on news events and economic reports that can influence market trends. This strategy requires quick action and a thorough understanding of how such events can impact different markets and assets.
Best Indicators for Trend Trading
Selecting the best indicators for trend trading is crucial for accurate market analysis and decision-making. Commonly used indicators include moving averages, the Relative Strength Index (RSI), and the Moving Average Convergence Divergence (MACD). Moving averages help in identifying the trend direction, while RSI and MACD can signal trend strength and potential reversals.
In my experience, combining these indicators provides a comprehensive view of the market, enhancing the likelihood of successful trades. However, it’s important to remember that no single indicator guarantees success; they should be used as part of a broader analysis strategy.
Moving Averages
Moving averages are crucial for trend trading, helping to smooth out price action and identify trend direction. The SMA provides a straightforward view of the trend, while the EMA gives more weight to recent price action, making it more sensitive to recent changes.
Relative Strength Index (RSI)
The RSI is a momentum indicator that measures the speed and change of price movements. It helps identify overbought or oversold conditions, signaling potential trend reversals or confirmations, making it an invaluable tool for trend traders.
Bollinger Bands
Bollinger Bands measure market volatility and provide insights into the strength of a trend. The bands widen during periods of high volatility and contract during low volatility, offering visual cues about the market’s momentum and potential trend reversals.
Trend Trading Chart Examples
Here are five charts that show trend trading in action!
Super League Gaming Inc. (NASDAQ: SLGG) — Strong Uptrend
This stock slowly rallied for a few months. Then it picked up steam and held its uptrend line. The growing volume and breakout over the highs make it a candidate for an even greater uptrend.
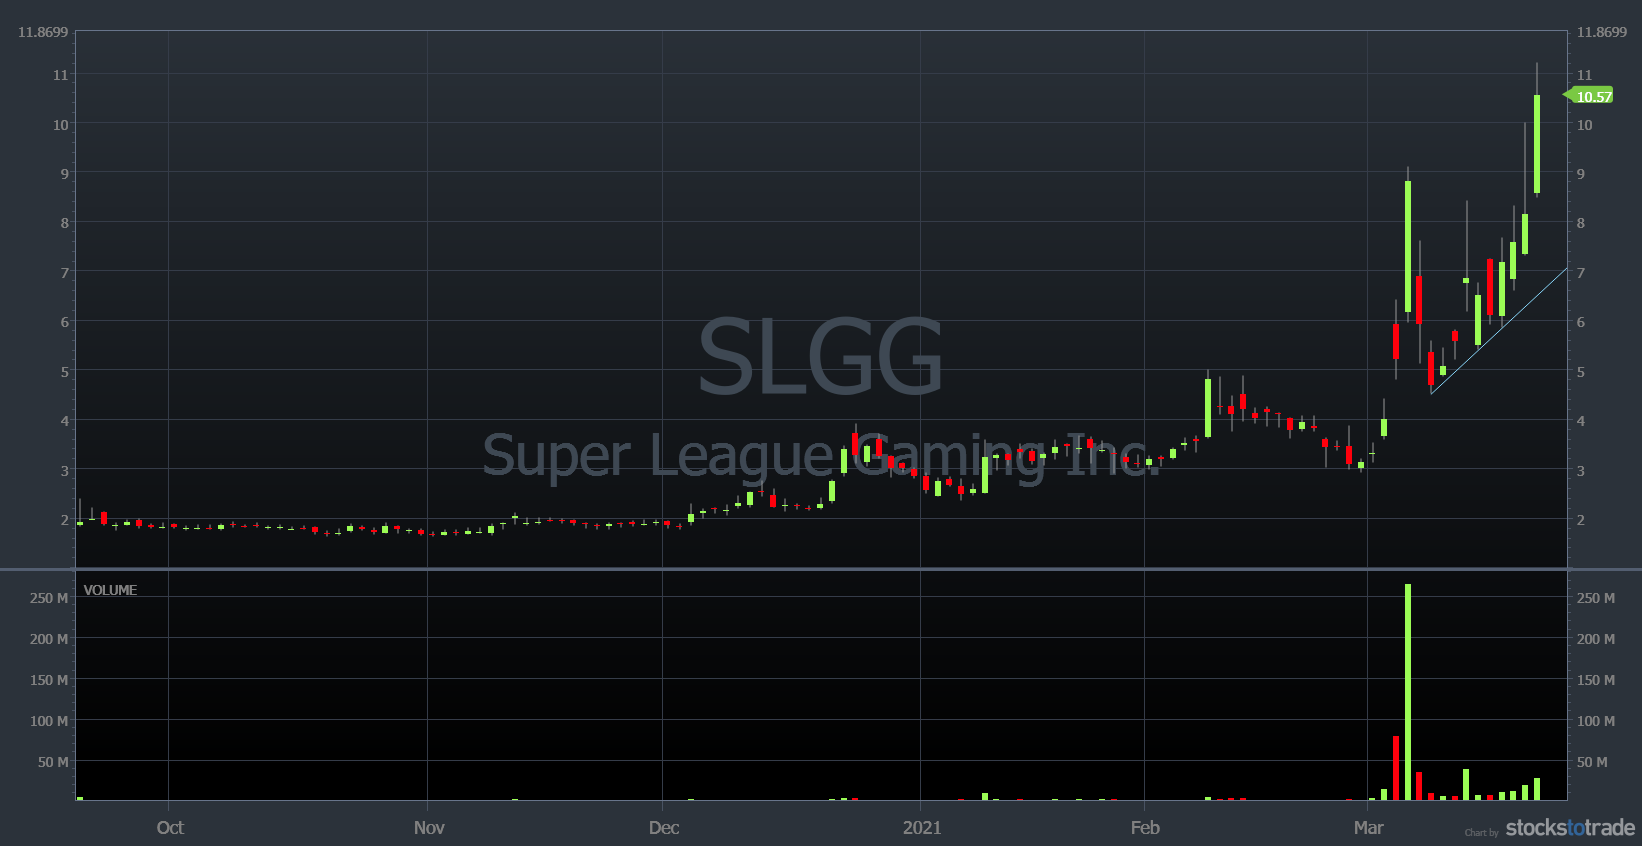
Super League Gaming Inc. 6-month chart (Source: StocksToTrade)
Bayport International Holdings Inc. (OTCPK: BAYP) — Clean Uptrend and Downtrend
BAYP steadily gained steam for several days. But it started losing volume as the green days went on. It had a blow-off top on the last day of its rally. It went from the $18s to almost $34 that day! That was the end of its run — it had an incredible panic in the afternoon that marked the end of its uptrend.
The first big red candle came on high volume. After a bounce the following day, the stock kept downtrending. In fact, a few days later it was halted and suspended from the OTC exchange. It will reopen on the gray market — likely far below its halted price.
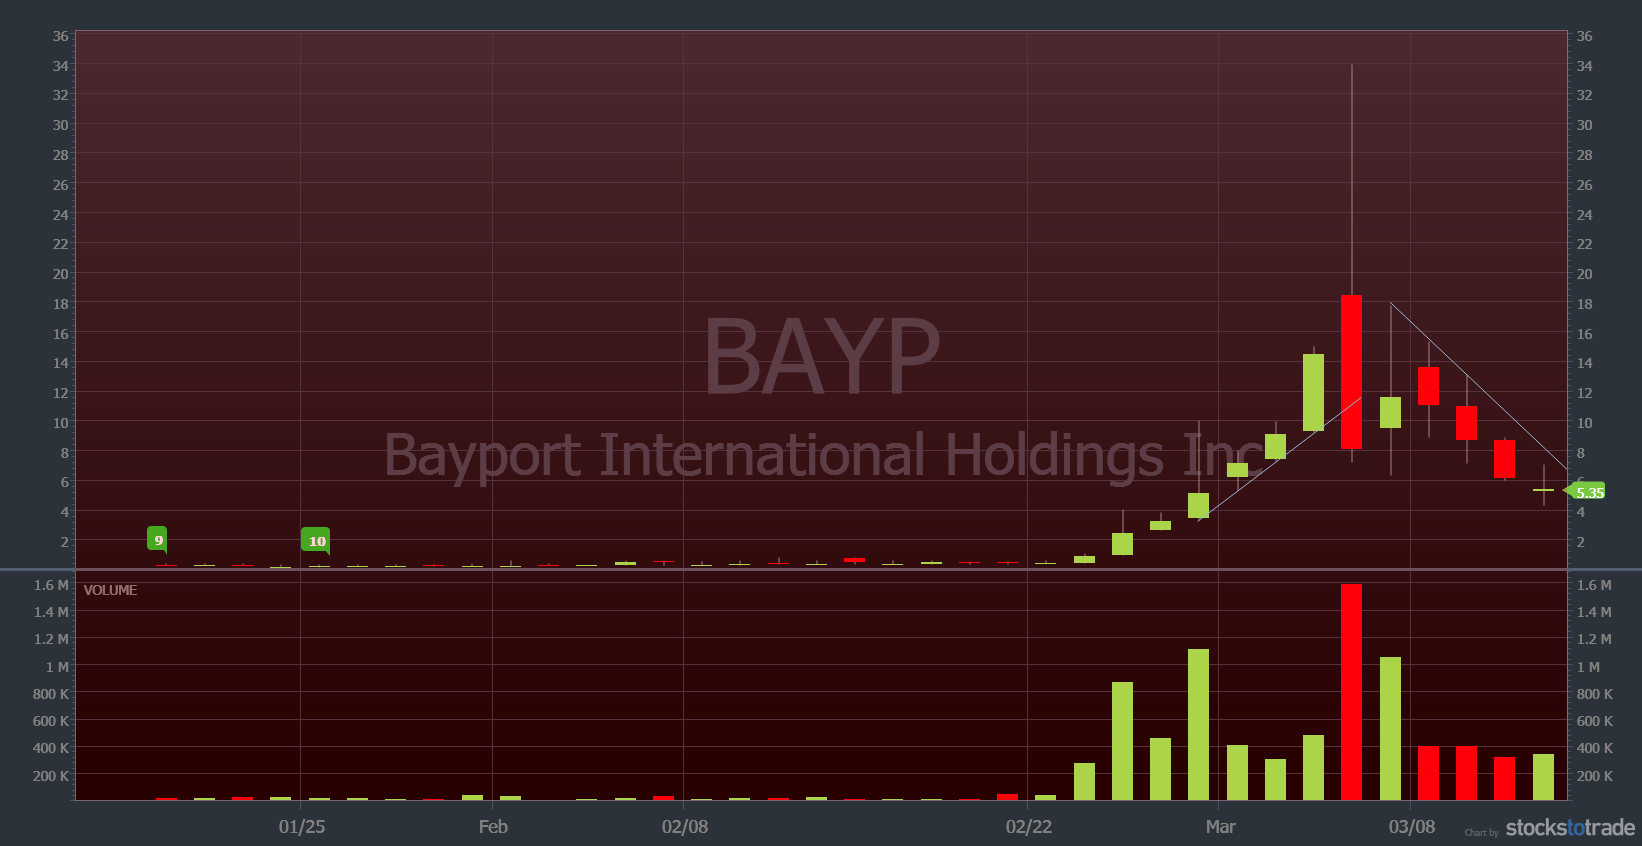
Bayport International Holdings Inc. 2-month chart (Source: StocksToTrade)
Ault Global Holdings Inc. (AMEX: DPW) — One and Done
This stock had a couple of one-and-dones in 2020 — those are circled on the chart. In each case, it was after the company released relatively good news.
It had another weak breakout in November 2020, again after a news release. It was only able to rise one day before selling off again. This stock will likely keep fading … until the next press release.
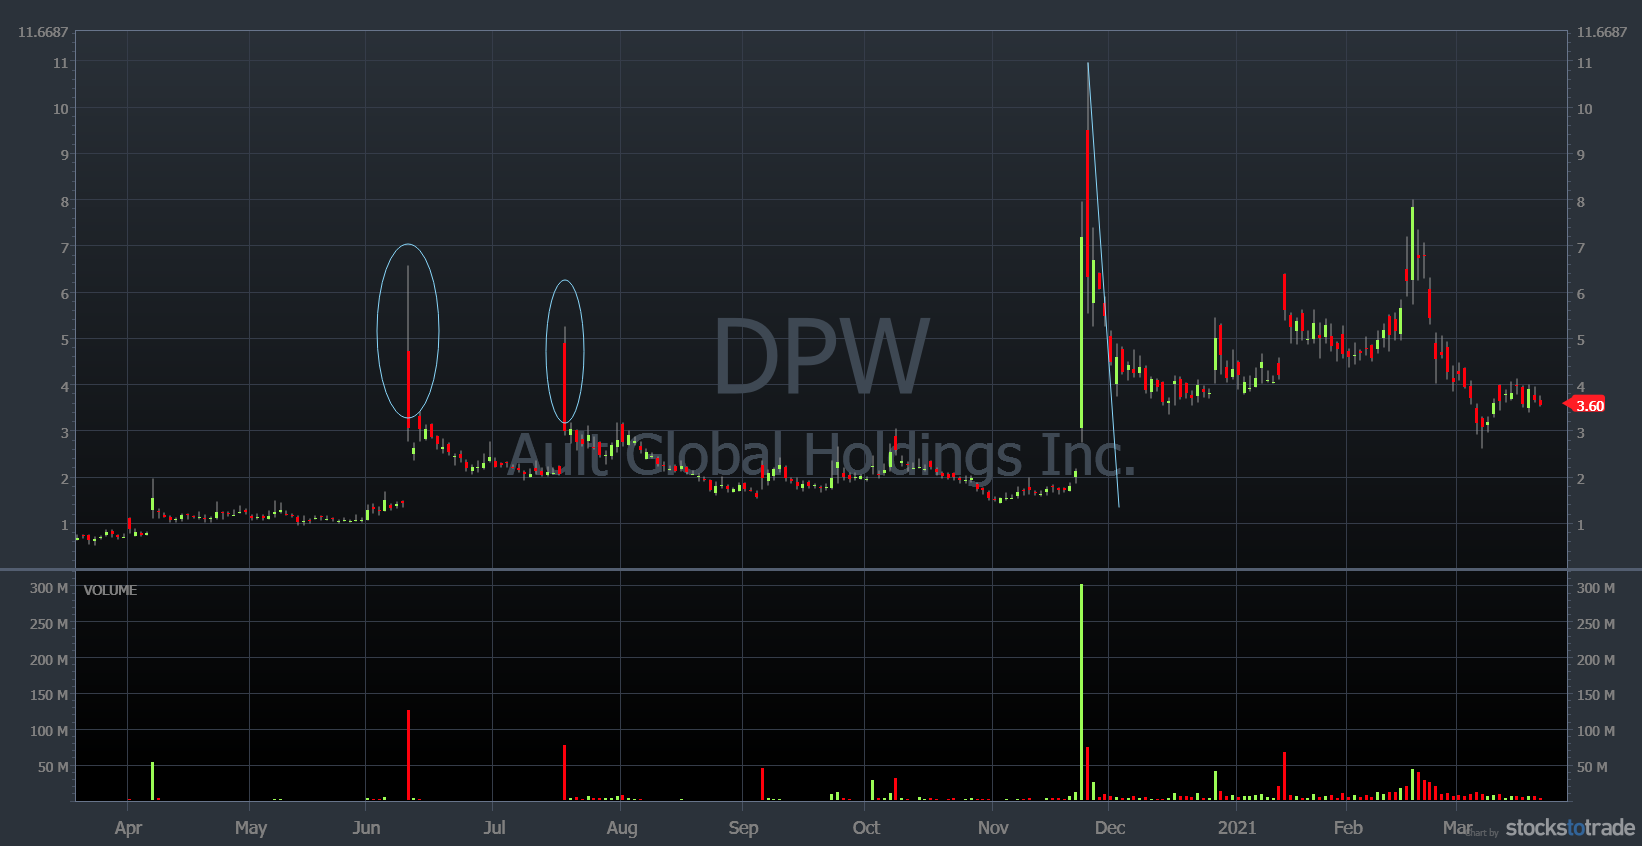
Ault Global Holdings Inc. 1-year chart (Source: StocksToTrade)
Tesla Inc. (NASDAQ: TSLA) — Broken Trendlines
One of the most hyped stocks in recent memory, TSLA slowly uptrended for months. That changed in late January 2021, when the stock broke both trendlines. It sold off over 30% of its market cap after breaking through the trendline.
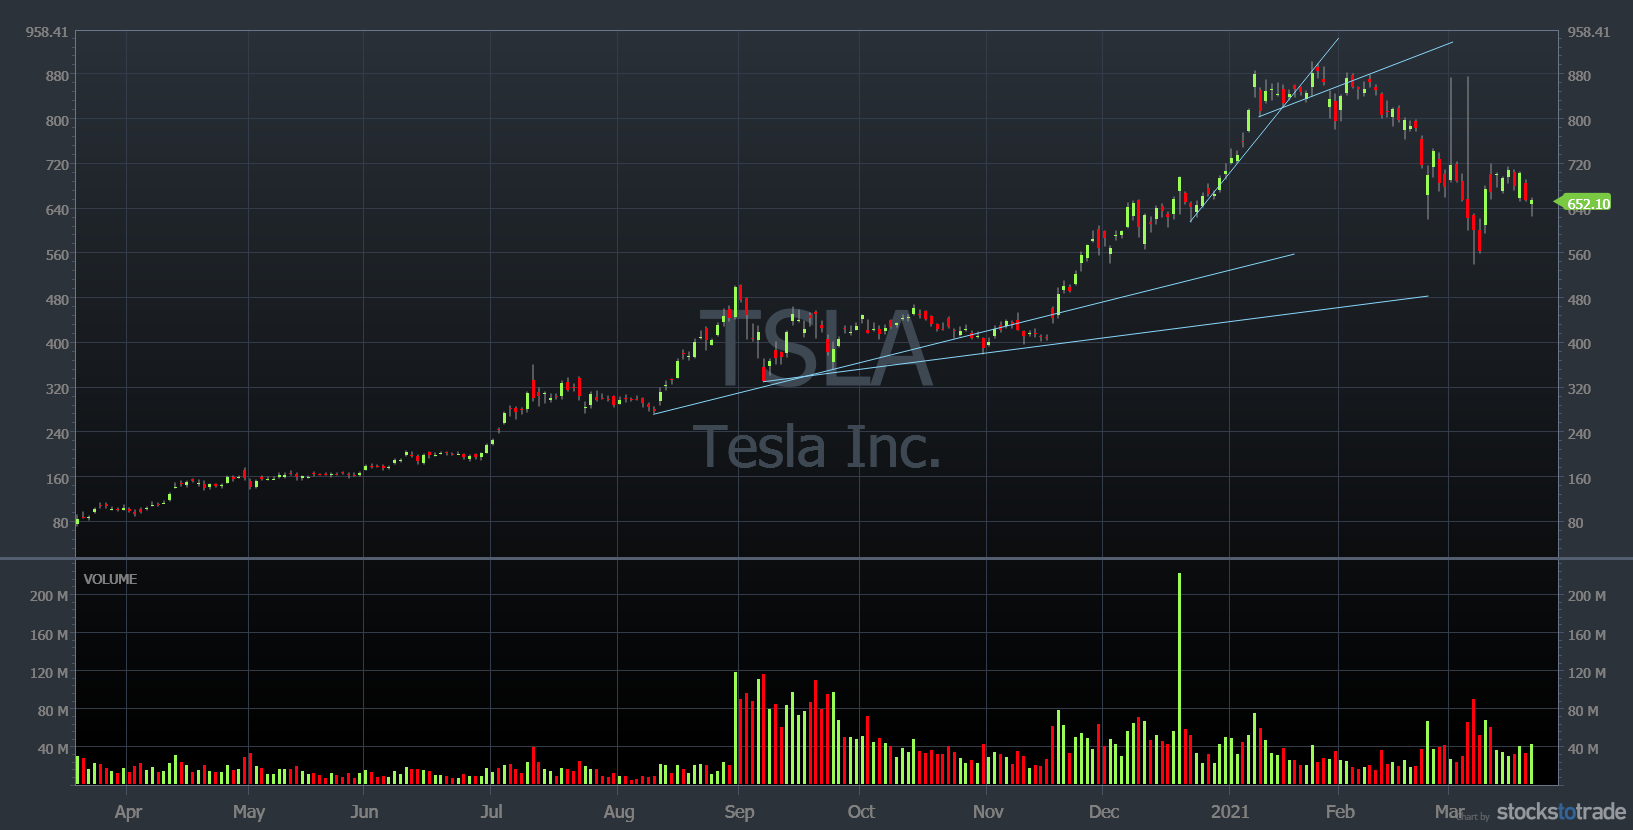
Tesla Inc. 1-year chart (Source: StocksToTrade)
Thai Airways International Public Co. Ltd. (OTCPK: TAWNF) — Strong Intraday Uptrend
Here we see a very strong uptrend, a response to a positive press release in the morning. The stock held VWAP from 11 a.m. on. The midday consolidation led to a massive rally and continuation in the afternoon. This helped the stock rally into the close. The action was similar to my VWAP-hold high-of-day break pattern.
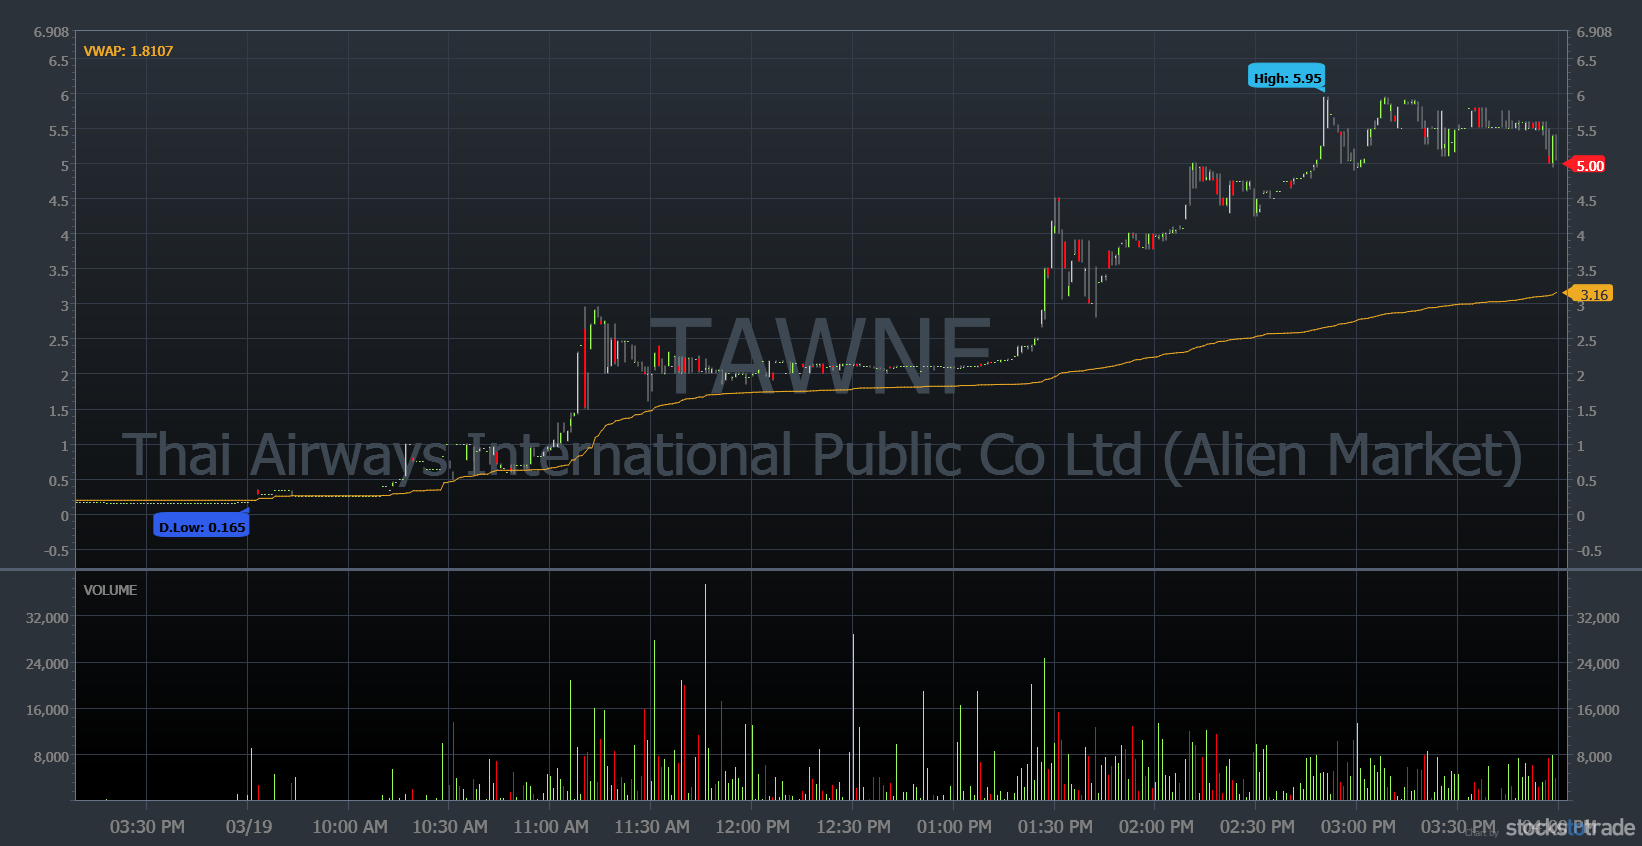
Thai Airways International Public Co. Ltd. 1-day, 1-minute candle (Source: StocksToTrade)
When Is the Best Time to Enter a Trend?
Determining the best time to enter a trend is a key aspect of trend trading. Ideally, entering at the start of a trend or during a pullback within an established trend offers the greatest potential for profit. Traders should look for clear indications of trend strength and sustainability before entering a trade.
In my trading experience, timing entry points is as much an art as it is a science, requiring a deep understanding of market signals and candle patterns. Patience and discipline are essential, as premature entries can lead to unnecessary risks and losses.
Strong Trend
A strong trend is characterized by consistent higher highs and lower lows in an uptrend, and the opposite in a downtrend. The best time to enter a strong trend is after a minor pullback or consolidation, which serves as an indication that the trend is likely to continue. Entering during a strong trend increases the probability of the trade being in your favor, but it’s crucial to be vigilant about potential reversals. The strength of a trend can be assessed through various tools like moving averages (MAs) and trendlines.
Healthy Trend
A healthy trend typically exhibits a steady and gradual movement, offering safer entry points. These trends are usually less volatile and provide more time to analyze and make decisions. The right entry point in a healthy trend is often after a period of consolidation, where the price stabilizes before continuing its trend. It’s important to confirm the trend’s continuity through technical indicators and to ensure your risk-reward ratio is favorable.
Weak Trend
In a weak trend, price movements are erratic and lack clear direction, making them less ideal for trend trading. However, they can still offer opportunities if traded cautiously. The key is to look for a stronger indication of trend continuation, such as a breakout from a consolidation pattern. Weak trends require a more rigorous risk management strategy to protect against sudden reversals.
How To Trade With the Trend
Trading with the trend involves aligning your trades with the current market direction. This strategy requires identifying the trend, planning your entry, setting stop-loss orders, and deciding on exit points. Traders should also consider the time frame and market conditions relevant to their trading style.
In my years of teaching, I’ve always emphasized the importance of consistency and discipline in following the trend. This means not only identifying the right trends but also managing trades effectively to maximize gains and minimize risks.
Understand What a Trend Is
A trend in trading refers to the general direction in which a market or a particular asset is moving. Understanding trends involves recognizing the patterns in price movements over a variety of timeframes. Trends can be upward (bullish), downward (bearish), or sideways (neutral). Recognizing these patterns helps traders make informed decisions about their trades.
Identify the Trend
Identifying the trend involves observing price movements and using technical analysis to determine the direction. This can be done using trendlines, which connect highs and lows in price data, and MAs, which smooth out price fluctuations to reveal the underlying trend. Paying attention to these indicators can help traders spot trends early and make more profitable decisions.
Choose Your Time Frame
Selecting the appropriate timeframe is crucial in trend trading. Day traders might focus on shorter timeframes like minutes or hours, while swing traders may look at daily or weekly charts. Each timeframe offers different opportunities and risks, and understanding this can greatly impact the success of your trades.
Use Trend Confirmation Tools
Tools like moving averages, trendlines, and volume indicators can confirm the strength and sustainability of a trend. These tools provide additional data points to support your analysis and can increase the accuracy of your trend predictions.
Plan Your Entry
Planning your entry involves deciding the point at which you will enter a trade based on the trend. Look for patterns like breakouts or retracements as entry signals. The timing of your entry is crucial and can greatly affect the outcome of your trade.
Set Stop-Loss Orders
A stop-loss order automatically closes your trade at a predetermined price to limit potential losses. It’s a critical tool in trend trading, especially in volatile markets. Setting a stop-loss helps manage risks and ensures that losses are kept within acceptable limits.
Trend Trading With Price Action
Trading with price action involves analyzing the movement of prices to make trading decisions. This method focuses on the price itself, rather than relying heavily on technical indicators. In trend trading, price action can give clear signals of trend continuation or reversal, helping traders time their entries and exits more effectively.
What Are the Risks of Trend Trading?
Trend trading, like all trading strategies, comes with inherent risks. The biggest risk is the trend reversing unexpectedly, which can lead to significant losses. Another risk is misidentifying a trend, resulting in entering a trade at the wrong time. It’s crucial to understand these risks and have strategies in place to mitigate them.
Risk Management in Trend Trading
Effective risk management is crucial in trend trading to protect against potential losses. This involves setting stop-loss orders, managing position sizes, and diversifying trades. A stop-loss order helps limit potential losses if the market moves against your position. Managing position sizes ensures that no single trade significantly impacts the overall account balance.
In my 15-plus years trading, I’ve learned that diversification across different trends and markets can also mitigate risks, as it reduces exposure to any single market movement. Remember, successful trend trading is not just about identifying trends, but also about managing risks efficiently.
Pairs Trading
Pairs trading involves taking opposing positions in two correlated securities. This strategy can help mitigate risks in trend trading by offsetting potential losses in one position with gains in the other. It requires careful analysis to identify suitable pairs and understand their correlation.
Take Profit
Setting a take-profit order allows you to lock in profits at a predetermined price level. This helps secure gains and avoids the risk of losing them if the trend reverses. It’s important to set realistic take-profit levels based on your analysis and market conditions.
Trailing Stop Loss
A trailing stop-loss order adjusts the stop price at a fixed percentage or dollar amount below the market price for a long position, or above the market price for a short position. This allows you to secure profits while giving the trade room to grow.
Manual Exits
Manual exits involve closing a trade based on your analysis and judgment, rather than an automated order. This strategy requires a deep understanding of market dynamics and the ability to make quick decisions in response to changing conditions.
Key Takeaways
Trend trading is a strategy that involves following market trends to make profitable trades. It requires understanding trends, identifying them correctly, choosing the right time frame, using trend confirmation tools, planning entries, and setting stop-loss orders. While trend trading can be highly profitable, it also comes with risks that need to be managed through strategies like pairs trading, take-profit orders, trailing stop losses, and manual exits.
Before you even think about becoming profitable, you’ll need to build a solid foundation. That’s what I help my students do every day — scanning the market, outlining trading plans, and answering any questions that come up.
You can check out the NO-COST webinar here for a closer look at how profitable traders go about preparing for the trading day!
What stocks are you watching? If you made it this far, write “I won’t trade without a plan” in the comments!
Frequently Asked Questions
Is Trend Trading Suitable for Beginners?
Trend trading can be suitable for beginners, especially those who take the time to understand the market and practice their strategies. Using a demo account can be a great way for beginners to practice without risking real money.
Is Trend Following Profitable?
Trend following can be a profitable strategy, especially in markets with strong, sustained movements. However, its profitability depends on the trader’s ability to correctly identify trends and manage risks.
What Is the Best Trend-Following Indicator?
There’s no single “best” indicator for trend following, as it often depends on the trader’s style and the market conditions. Commonly used indicators include moving averages, MACD, and RSI. Each has its own strengths and can be used in combination for more effective trend analysis.