The first green day pattern is a favorite of many traders…
If you’re familiar with breakout trading, this pattern should be easy to understand. The first green day is just a different way to look at what’s happening with a stock that’s breaking out.
Looking at a stock’s trend in this way can show potential entry and exit points for a trading plan.
This is the kind of analysis we do every trading day on the SteadyTrade Team. Every morning and afternoon, we break down repeatable patterns like this one.
We’re looking at how the market reacts to stocks. This takes a lot of the guesswork out of stock moves, so you can build trading plans that limit your risk. If you want to be part of our incredibly collaborative team, learn more about the SteadyTrade Team and sign up here.
Table of Contents
- 1 First Green Day Pattern: What Is the First Green Day in Trading?
- 2 What the First Green Day Pattern Does
- 3 Why Trade the First Green Day Pattern?
- 4 First Green Day vs. First Red Day: What’s the Difference?
- 5 How to Identify the First Green Day Pattern
- 6 How to Trade Stocks Using the First Green Day Pattern
- 7 Practical Examples of First Green Day Pattern
- 8 Conclusion
First Green Day Pattern: What Is the First Green Day in Trading?
When we talk about a first green day stock pattern, we’re looking at a chart that’s been in a steady downtrend. Or maybe it’s been chopping within a price range for a while.
But then some catalyst comes along that brings unusual volume into the stock. This sends the price trending up.
What the First Green Day Pattern Does
When this setup works, the spike that sets up the first green day pattern isn’t the last one.
We call it the ‘first green day’ because we’re anticipating more green days, maybe a second or third.
Why Trade the First Green Day Pattern?
My trading mentor and friend Tim Sykes is one of the biggest defenders of the first green day pattern. You can see us talking about it onstage here. We recorded this live — remember when we used to do that?
Sykes loves trading first green day OTC penny stocks. He says that using this pattern is one of the best ways to take advantage of market inefficiencies.
With listed stocks, big news spreads fast. Any catalysts are usually priced into the stock pretty quickly. If you miss the first green day spike on a listed stock, you’ve lost the element of surprise. The whole market knows what you know.
That’s why I like waiting till the afternoon to trade this pattern with Nasdaq or NYSE stocks. You know that people are interested … now you just have to see if they hang around. If they do, the stock has a shot at trending upward even more.
But OTC stocks are a different kettle of fish. News can spread more slowly with them. If the spike’s based on real news, the mainstream will start covering it. And as they do, more traders can trickle in and push the stock higher.
First Green Day vs. First Red Day: What’s the Difference?
What is a first red day pattern? That’s the point where you want to be out of the trade.
When you’re looking to trade the first green day pattern, you’re tracking a few things. We want to see a good news catalyst. We want a lot of volume in the stock. And we want to see that interest stick around. This sets up a support level for the stock to make its next move.
We want it to be part of a multi-day breakout. This makes it easier to trade because you don’t have to be in it from the initial move. And when you exit the trade, you can sell into strength.
When we’re trading this pattern, we’re usually looking at smaller-cap stocks. We want stocks with low float, where the additional volume can really make a difference. The combination makes for a lot of volatility.
This volatility is what my teaching system is built around. If you don’t know why volatility can be good for a stock, check out the no-cost “Volatility Survival Guide” Sykes made. I put in an appearance too.
But the thing about volatility is that it goes both ways. Most of the time, a first green day stock spike isn’t based on news that will permanently transform a stock’s value. That means that the price will eventually go down. That first red day often signals the end of the breakout.
How to Identify the First Green Day Pattern
How do we know if a stock is following this first green day pattern? Or if it’s a one-and-done like so many sketchy stocks out there
The answer is in confirmation. And the way you get that is by using a good stock screener and news scanner like StocksToTrade. Without confirmation, you’re just gambling.
When trying to identify a stock that’s at the beginning of a multi-day move, look for a few important signs. If your stock screener can’t scan for them, you can’t create a good trading plan.

StocksToTrade’s stock screener looks for all the things I want to see in a first green day stock. It scans for volume and float size, so you can easily see the balance of supply and demand.
Its wide-ranging news scanner covers all the news catalysts that can move a stock. From press releases to tweets to earnings reports — it’s all there.
And let’s not forget the charts! StocksToTrade’s precise charts give me the best window into this pattern as it’s unfolding.
Grab your 14-day STT trial today — it’s just $7.
How to Trade Stocks Using the First Green Day Pattern
OK … this is the big question. You can study old charts and see when one green day has led to another. But how do you trade it when it’s happening?
My answer: wait for the afternoon.
That’s when a stock can either hold its spike or fail. You can use the ABCD pattern or the VWAP hold pattern for confirmation … There are a lot of afternoon patterns you can use.
Basically, what I’m looking for is a stock that’s proven itself. So look for that big morning spike. Then watch for the stock to hang around all day.
That can indicate a stock’s headed for a multi-day breakout. And that this first green day won’t be its last.
If it breaks in the afternoon, it doesn’t mean that it’s guaranteed. What it means is that buyers have hung around all day and are still interested.
Using afternoon patterns also helps with your discipline. Many traders get FOMO after a stock breaks big in the morning. But when you see those afternoon patterns working, that means it’s not a flash in the pan. The party’s still going.
Here are some tips for trading this pattern…
Scan for Big Percent Gainers
A lot of times, we get some warning on the first green day pattern. Maybe it’s a major piece of news like an earnings report. Whatever it is, it should show up on your top percent gainer scan, with big volume to match.
Make Sure It’s Real News and a Real Stock
You want to see the market interest continue. For that to happen, you’ll need more than a Twitter post pumping a sketchy stock.
Wait for the Afternoon
One of the biggest things we look for in a multi-day runner is sustained interest. That means the buyers are still hanging around after the big news has come out. It’s the best sign that the stock still has room to grow.
It Finishes on the High of Day
It’s even better if it ends the day on a 52-week high or an all-time high. That shows you that the stock is still trending up — and might hit even higher levels after hours. It also helps ensure there an army of bagholders isn’t waiting to unload shares near the level where they bought them.
Wait for a Pullback
What is a morning panic in stocks? It’s when people held a stock overnight then want to take profits. That pushes the price down. And it triggers stop losses on the way, making more traders exit their positions.
When everything else looks good, this morning dip could be an ideal entry.
Practical Examples of First Green Day Pattern
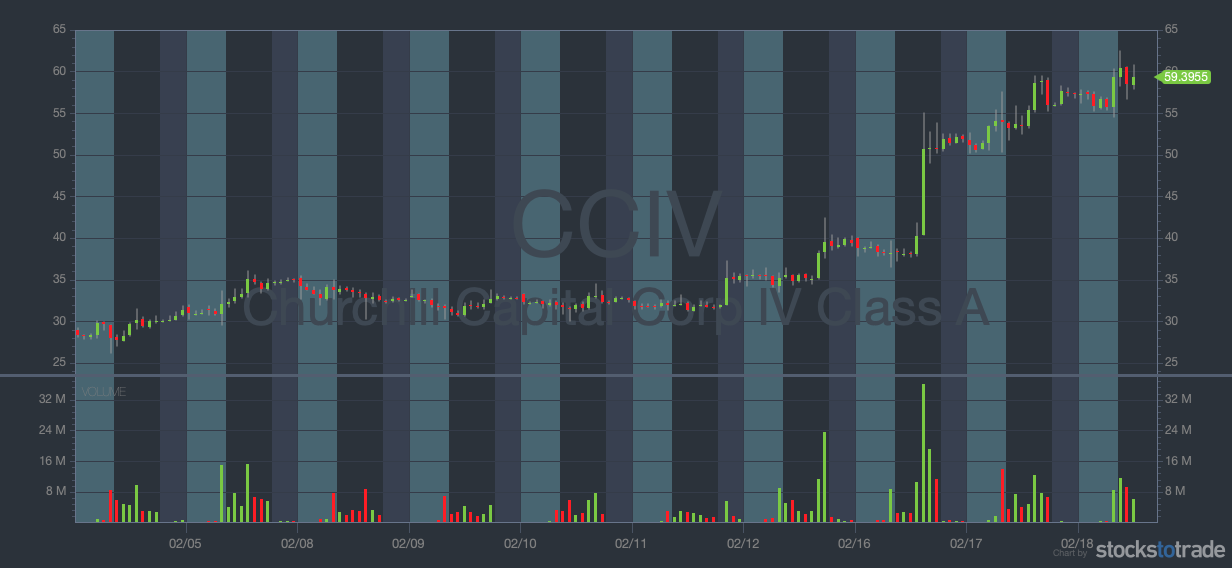
Churchill Capital Corp IV (NYSE: CCIV) 10-day chart (Source: StocksToTrade)
It’s easy to see when it’s already played out. Let’s take a look at this chart for Churchill Capital Corp IV (NYSE: CCIV).
You can see that CCIV made a big multi-day move here with plenty of trading opportunities. The first green day was just a setup for a bigger move on the third green day.
This was also a great example of one of my favorite pieces of stock wisdom: ‘Buy the rumor, sell the news.’ CCIV was grinding up to its breakout on rumors of a SPAC with the EV company Lucid Motors.
Everyone likes to be the first one to hear a hot stock tip. When the deal later became official, CCIV’s stock fell. The excitement was over.
Conclusion
The first green day pattern often works great in a bull market. When the market’s on the rise, solid news and big volume can make all the difference.
But be careful about believing too much in this pattern — or any pattern. What we believe in most on the SteadyTrade Team is discipline. We’d rather walk away from an imperfect setup than chase a stock that doesn’t feel right.

It can be hard to tell the difference without a good community of traders on your side. Join the SteadyTrade Team today if you’re ready to up your trading game day by day.
How do you feel about the first green day pattern? Let me know in the comments — I love hearing from my readers!